

I promised some data about what exactly happened to property valuations in Apex. All the below data only deals with residential properties which existed in 2020.
First, I wanted to see how the “curve” of property values have shifted in 4 years. The median home value in Apex has increased from $365k to around $570k, which is massive, but it’s interesting to see that the “curve” has flatted some.

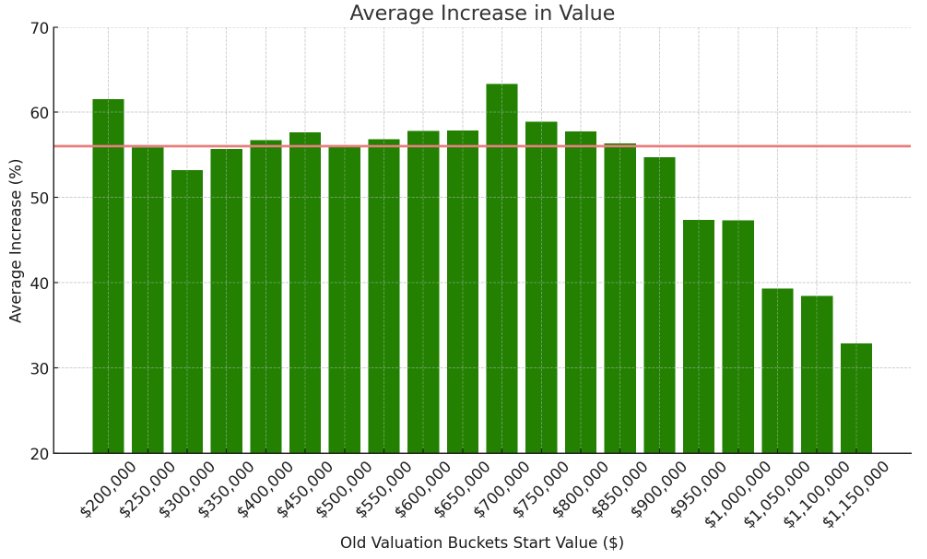
Additionally, a major concern I had was that the increase in valuation would be heavier on the lower end of the property valuation range. The net result here is this would shift the tax burden to those with lower value homes, and give a tax cut to those with really expensive homes. Indeed, that is what happened, but it’s not as dramatic as I had feared. People whose homes were valued close to $1,000,000 or more in 2020 indeed got a tax cut, but that additional tax burden is shifted pretty evenly across the homes below that value. I added a line at 56% to give a rough idea as to where the tax neutral value increase would be.
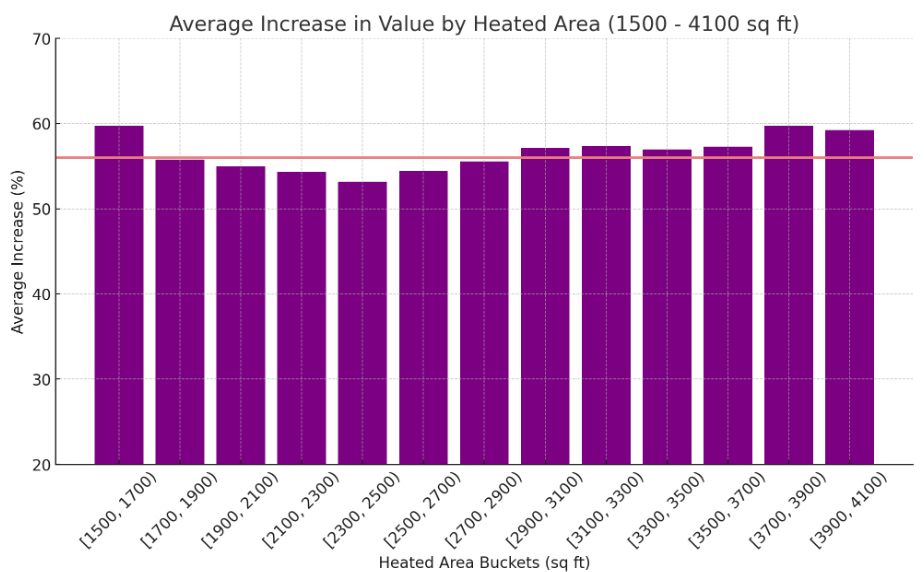
I also charted the same data based on heated area (square ft), but this was relatively uniform.
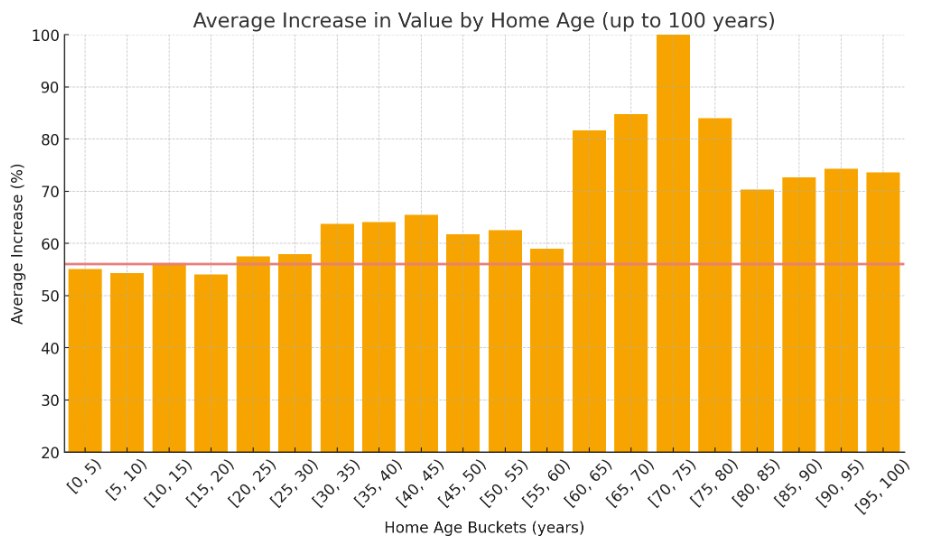
More interesting was charting based on home age. Older homes increased in value noticeably more than younger homes!
What about where the increases are? Here is a list of the Top 10 Streets with the largest average increase in value:
- OLD US 1: 232.99%
- CULVERT: 105.36%
- CASTLEBERRY: 99.93%
- GROVE: 99.45%
- WHITE OAK BRANCH: 96.82%
- WRENN: 96.42%
- SALIENT: 94.88%
- KEITH: 94.76%
- IRONGATE: 92.60%
- WHITE OAK CREEK: 91.31%
And here are the streets with the Lowest 10 Average Increases, and are in line for significant tax reductions:
- GOLIATH: 27.61%
- EDWARDS POND: 28.82%
- SATTERFIELD: 30.70%
- MASONBORO FERRY: 31.61%
- DALLAS VALLEY: 32.94%
- LAUDER: 35.73%
- GLASTON: 36.08%
- DILLY DALLY: 36.74%
- ELBURY: 37.08%
- DALTON RIDGE: 37.20%
If you read this far, I hope you found this data insightful. Let me know if you have any thoughts or questions.
